Analyzing complex expriments
The GES-echem-suite library provides some custom made experiment class explicitly designed to facilitate the analysis of composite experiments. At this time the following experiment types are supported:
Rate analysis: Analysis of more than one cell-cycling experiment carried out at a different value of constant-current
The analysis of charge/dischage rate experiments
The RateExperiment class can be used to analyze more than one cell-cycling experiment carried out at a different value of constant-current. A RateExperiment object can be created in different ways:
Directly constructued by the user, by providing a list of current values and a list of the corresponding
CellCyclingobjectsConstructed from a Bilogic Battery module file using the
from_Biologic_battery_moduleclassmethod.Constructed from a ARBIN datafile formatted as a
.csvtable using thefrom_ARBIN_csv_fileclassmethod.Constructed from a GAMRY “standard” folder tree using the
from_GAMRY_folder_treeclassmethod.
An ARBIN .csv file can be loaded following the code:
from echemsuite.cellcycling.experiments import RateExperiment

# Create a RateExperiment from a Biologic Battery Module file
experiment = RateExperiment().from_ARBIN_csv_file("../../utils/arbin_sample.CSV")
print(experiment)
[]
[0.5, 1.0, 1.5, 2.0, 2.5, 1.5]
Rate Experiment
----------------------------------------
0.5A : 1 cycles
1.0A : 4 cycles
1.5A : 5 cycles
2.0A : 5 cycles
2.5A : 1 cycles
1.5A : 29 cycles
----------------------------------------
Similarly, a Biologic Battery module file can be loaded following the code:
from echemsuite.cellcycling.experiments import RateExperiment

# Create a RateExperiment from a Biologic Battery Module file
experiment = RateExperiment().from_Biologic_battery_module("./example_Biologic_BatteryModule/example_BattModule.mpt")
print(experiment)
[]
[]
Rate Experiment
----------------------------------------
0.5A : 1 cycles
1.0A : 5 cycles
1.5A : 5 cycles
2.0A : 5 cycles
2.5A : 5 cycles
3.0A : 5 cycles
3.5A : 5 cycles
4.0A : 5 cycles
4.5A : 5 cycles
5.0A : 5 cycles
----------------------------------------
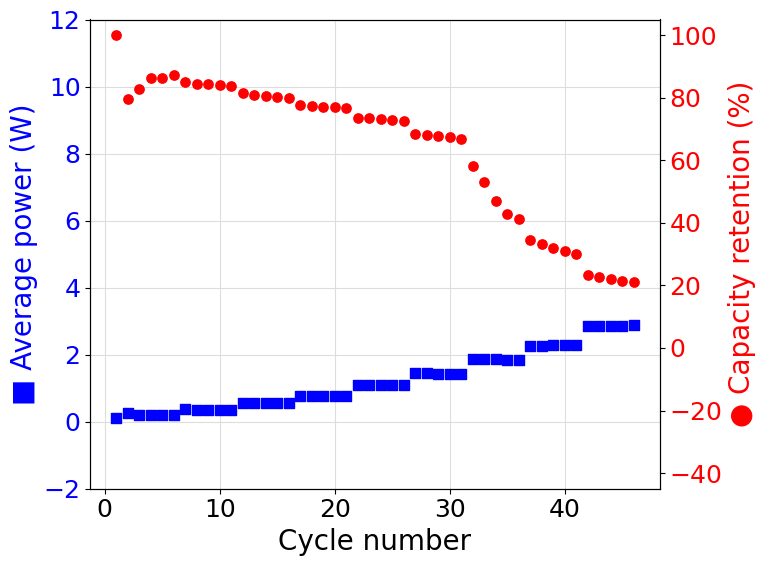
Now that the RateExperiment object representing the experiment has been obtained all the experimental data and derived quantities can be accessed using the built-in class methods and properties. The following script shows how the data can be accessed and graphically represented:
import matplotlib.pyplot as plt
from echemsuite.cellcycling.experiments import RateExperiment

# Create a RateExperiment from a Biologic Battery Module file
experiment = RateExperiment.from_Biologic_battery_module("./example_Biologic_BatteryModule/example_BattModule.mpt")

# Select the values to plot in the graph
N = experiment.numbers
AP = experiment.average_power
CR = experiment.capacity_retention

# Plotting the data
plt.rcParams.update({'font.size': 18})
fig, ax1 = plt.subplots(figsize=(8, 6))

color_ax1 = "blue"
ax1.scatter(N, AP, c=color_ax1, marker="s", s=45, zorder=3)
ax1.tick_params(axis="y", labelcolor=color_ax1)
ax1.set_xlabel("Cycle number", size=20)
ax1.set_ylabel("■ Average power (W)", c=color_ax1, size=20)
ax1.set_ylim((-2, 12))
ax1.grid(which="major", c="#DDDDDD")
ax1.grid(which="minor", c="#EEEEEE")

ax2 = ax1.twinx()
color_ax2 = "red"
ax2.scatter(N, CR, c=color_ax2, marker="o", s=45, zorder=1)
ax2.tick_params(axis="y", labelcolor=color_ax2)
ax2.set_ylim((-45, 105))
ax2.set_ylabel("● Capacity retention (%)", c=color_ax2, size=20)

plt.tight_layout()
plt.show()
[]