Using the graphicaltools module
The graphicaltools module contains all the basic tools required to manipulate colors and to help the final user in the creation of plots and graphs required for data visualization.
The Color class
The core object of the module is the Color class. The class is used to represent color values and store the information in RGB format (each channel is stored as a value going from 0 to 1). An instance of the Color class can be created directly, using the default constructor, providing it with a float value for each channel color.
from echemsuite.graphicaltools import Color

red = Color(1, 0, 0)
print(red)
Color(1.00, 0.00, 0.00)
An instance of the color class can also be created by providing an RGB HEX sting to the from_HEX classmethod according to:
red = Color.from_HEX("#FF0000")
print(red)
Color(1.00, 0.00, 0.00)
Once an istance of the Color class has been created the color can be obtained using the RGB and HEX properties.
color = Color(1, 0.5, 0)
print(color.RGB)
print(color.HEX)
(1, 0.5, 0)
#ff7f00
The ColorShader class
The ColorShader class provides the user with a simple tool to generate sequential color shades to be used in the plots. A ColorShader object can be constructed by specifying a basecolor and a number of levels of shade according to:
from echemsuite.graphicaltools import ColorShader

basecolor = Color.from_HEX("#AA00FF")
shader = ColorShader(basecolor, levels=10)
The shades of color can be obtained using the bracket notation or using the provided iterator:
print("Using __getitem__:")
print(shader[2])

print("Using __iter__:")
for c in shader:
    print(c)
Using __getitem__:
Color(0.86, 0.58, 1.00)
Using __iter__:
Color(0.93, 0.80, 1.00)
Color(0.90, 0.69, 1.00)
Color(0.86, 0.58, 1.00)
Color(0.82, 0.47, 1.00)
Color(0.79, 0.36, 1.00)
Color(0.75, 0.24, 1.00)
Color(0.71, 0.13, 1.00)
Color(0.67, 0.02, 1.00)
Color(0.61, 0.00, 0.91)
Color(0.53, 0.00, 0.80)
The following code demonstrates the effect that a ColorShader can have on a plot:
import matplotlib.pyplot as plt
from echemsuite.graphicaltools import ColorShader

basecolor = Color.from_HEX("#AA00FF")
shader = ColorShader(basecolor, levels=15)

fig = plt.figure(figsize=(12, 1))
plt.axis("off")

for i, color in enumerate(shader):
    plt.scatter([i], [0], c=[color.RGB], s=900, marker="s")

plt.show()

The Palette class
The palette class provides the user with a simple interface to colors palettes of various origin. The class currently implements the following set of palettes:
The default matplotlib color sequence:
matplotlibThe qualitative color palettes from palettable:
bold,pastel,prism,vivid
An instance of the Palette class can be constructed by specifying the keyword associated to the desired palette. The colors of the palette can then be obtained by index, using the __getitem__ method, adopting the square brackets notation:
from echemsuite.graphicaltools import Palette

mypalette = Palette("matplotlib")
mycolor = mypalette[0]

print(f"The first color of the matplotlib palette is: {mycolor}")
The first color of the matplotlib palette is: Color(0.12, 0.47, 0.71)
Please notice how the palett has a limited number of colors that can be obtained using the len function. If the index of the required color is greater than the number of available colors the colorsequece will loop around returning the same color sequece. As an example:
from echemsuite.graphicaltools import Palette

mypalette = Palette("prism")

ncolors = len(mypalette)
print(f"The prism palette has {ncolors} colors")
print(f"The first color is {mypalette[0]}")
print(f"The color at index {ncolors} is: {mypalette[ncolors]}")
The prism palette has 8 colors
The first color is Color(0.37, 0.27, 0.56)
The color at index 8 is: Color(0.37, 0.27, 0.56)
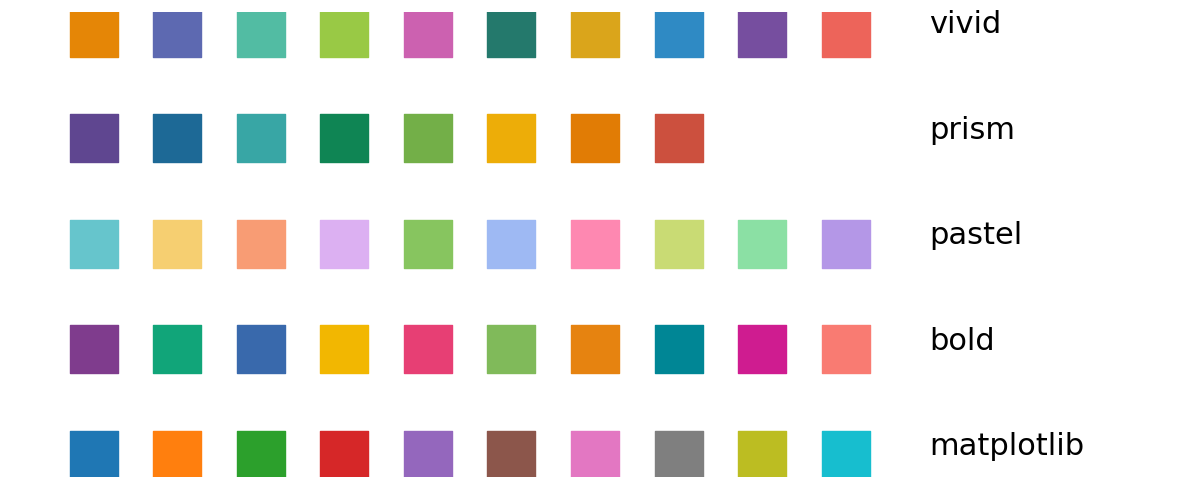
A visual representation of all the available palettes is reported in what follows:
import matplotlib.pyplot as plt
from echemsuite.graphicaltools import Palette

palette_names = ["matplotlib", "bold", "pastel", "prism", "vivid"]

fig = plt.figure(figsize=(12, 5))
plt.axis("off")

for y, name in enumerate(palette_names):
    palette = Palette(name)
    plt.text(10, y, f"{name}", fontsize=22)
    for x in range(len(palette)):
        color = palette[x]
        plt.scatter([x], [y], c=[color.RGB], s=1200, marker="s")

plt.xlim((-1, 13))
plt.tight_layout()

plt.show()